
Almost every average question on the Australian AMC collapses if you make one move: stop thinking in averages and start thinking in totals. Average multiplied by count gives a total; totals can be added, removed and compared; then you divide back at the end. This article covers that move, the traps that beat strong students, how to read a table under a running clock, and why most chance questions are really counting questions wearing a disguise.
Every worked example below is written by our editorial desk in the style of the competition. None of them reproduces an actual AMC question, and the published topic outline for the paper sits on amt.edu.au – check it there rather than inferring scope from any article, including this one. If you are new to the competition, our Australian AMC overview for students in China covers the six levels and the China-region calendar.
Why averages are the highest-leverage data skill on the paper
Data questions have a useful property for a timed paper: they are mechanical once you know the move, and paralysing when you do not. The paper runs 30 questions for 135 marks, with questions 1-10 worth 3 marks each and questions 11-20 worth 4 marks each – so the 70 marks in the front two-thirds are exactly where a reliable, repeatable method pays. Averages questions can appear anywhere on the paper, and they are the type most likely to be dropped for a silly reason rather than a mathematical one.
There is a second reason to drill them. Because AMT states there is no penalty for incorrect responses, an average question you half-understand is still worth attempting. But a half-understood method usually produces the trap answer, and the trap answer is almost always one of the five options. Guessing from a wrong method is worse than guessing at random, because the wrong method walks you directly into the distractor the question was built around.
The totals move
Write it once at the top of your rough working and never deviate: total = average × count. Convert every average in the question into a total, do the arithmetic on totals, then convert back only at the very end.
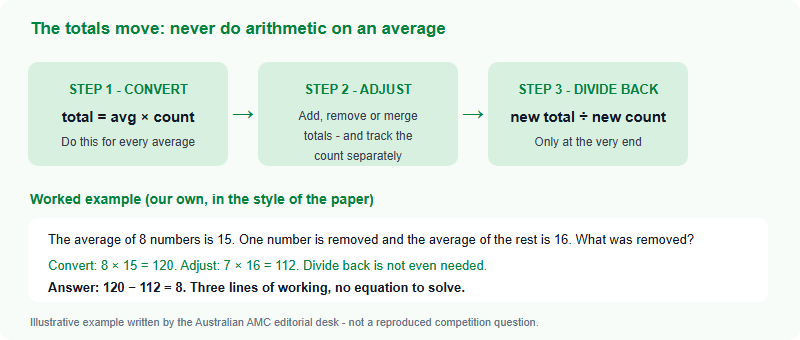
Two more of our own examples showing the same three steps:
- Adding a value. Five test scores average 72; a sixth score of 90 is added. Convert: 5 × 72 = 360. Adjust: 360 + 90 = 450. Divide back: 450 ÷ 6 = 75. Note the average moved by 3, not by 18 – the new value is shared across all six.
- Merging two groups. Class A has 20 students averaging 70; Class B has 30 students averaging 80. Convert: 1400 and 2400. Adjust: 3800. Divide back: 3800 ÷ 50 = 76. The tempting answer, 75, is the average of the two averages, and it is wrong because the classes are different sizes.
That second example is the entire reason this method matters. Once totals are on the page, weighted averages stop being a separate topic requiring a separate formula. They are just addition.
The traps that beat strong students
Data questions on a timed paper are designed so that the fast wrong answer is available as an option. These are the ones that cost the most marks.
| Trap | What students do | Why it fails | The fix |
|---|---|---|---|
| Average of averages | Add the two averages and halve | Only valid when the two groups are exactly the same size | Convert both to totals first, always |
| Median of an even list | Pick one of the two middle values | With an even count there is no single middle term | Sort, then take the mean of the middle two |
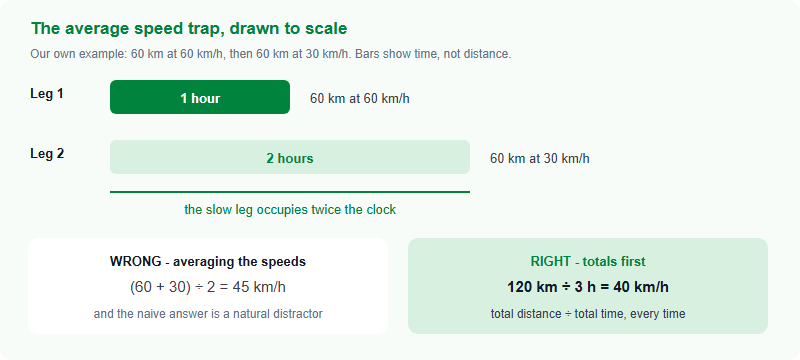
| Average speed | Average the two speeds | More time is spent at the slower speed, so it weighs more | Total distance divided by total time – never speeds divided by two |
| Unsorted data | Read median or range straight off the list | The list is often deliberately given out of order | Sort before reading anything positional |
| Mode with a tie | Assume there is exactly one mode | A set can have two modes, or none | Count frequencies rather than eyeballing |
Reading tables and charts against the clock
Questions built around a table, a bar chart or a two-way grid look generous and eat time. The information is all there, which invites reading everything. In a paper where the early questions are worth 3 marks each, reading everything is a losing strategy.
- Read the question before the table. Know which single number you are hunting, then go and get it. This one habit is worth more marks than any technique on this page.
- Check the units and the row labels once, deliberately. Tables in a bilingual paper often carry a unit in the header that changes the answer – thousands, percentages, or per-person figures. Missing it produces an answer that is right by a factor of a thousand.
- Watch for “how many more” versus “how many times”. One is a subtraction, the other a division, and both answers will be sitting in the options.
- Beware percentages of different bases. Thirty per cent of one group and thirty per cent of another are not the same number of people. Convert to counts before comparing.
- Totals rows are a gift. If a two-way table gives row and column totals, one missing cell is usually recoverable by subtraction in a single step.
Chance questions are counting questions in disguise
Probability at competition level rests on a single sentence: the probability of an event is the number of outcomes you want, divided by the total number of equally likely outcomes. All the difficulty lives in the counting, not the probability – which is why the technique for organised counting is worth studying as its own topic, separately from this one.
Three habits handle most of what appears:
- Write the denominator first. Fixing the total number of outcomes before hunting for favourable ones prevents the most common error, which is counting the two with different assumptions.
- Use the complement for “at least”. Our own example: a bag holds 3 green and 5 white counters, and two counters are drawn with the counter replaced each time. The probability of at least one green is 1 − (5/8) × (5/8) = 1 − 25/64 = 39/64. Counting the “at least one” cases directly takes three times as long and produces the same number.
- Decide whether the first item goes back. With replacement, the denominator stays the same; without replacement, it drops by one and the two draws are linked. Read that sentence in the question twice – it is the difference between two answers that are both on the option list.
What this looks like at each level
The China region runs six levels, Pre-A to E, across Grades 1-12, and data questions appear across the whole ladder. What changes is how many steps sit between the data and the answer.
| Level band | Typical demand | What to drill |
|---|---|---|
| Pre-A and A (younger primary) | Reading a picture graph or simple table – Pre-A is new for 2026, so confirm its scope on the ASDAN China-region listing | Careful counting, and the habit of reading the question first |
| B and C (middle years) | Adding or removing one value; weighted comparison of two groups; simple chance with one draw | The totals move, until it is automatic |
| D and E (senior) | Averages combined with algebra; two-stage chance; data embedded inside a longer multi-step problem | Complement counting, and spotting when an average is only a step, not the answer |
A twenty-minute drill that works at any level: take ten average questions from your practice bank, and instead of solving them, write only the totals line for each. Ten conversions, no answers. The aim of the drill is to make the totals line automatic, so the average-of-averages shortcut stops being the first thing a student reaches for.
With the China-region exam on 11 October 2026 and registration closing on 28 September, there is comfortable room for this kind of narrow, high-return work. For the levels, format and calendar in one place, see our Australian AMC guide for students in China.
Questions we get asked
Why is the average of two class averages usually wrong?
Because it only works when both groups are the same size. Convert each class to a total first, add the totals, then divide by the combined headcount.
How do I find the median of an even-length list?
Sort the list, then take the mean of the two middle values. The list is often given out of order on purpose.
What is the fastest way to handle an “at least one” chance question?
Work out the probability that it never happens, then subtract from 1. Counting the cases directly takes far longer.
Are the examples in this article real AMC questions?
No. Every example is written by our editorial desk in the style of the paper. The official topic outline is published on amt.edu.au.
Published by the Australian AMC editorial desk, operated by Hanlin Education for China-based international-school students. The Australian Mathematics Competition is run by the Australian Maths Trust (AMT, Australia, since 1978) with ASDAN as the China-region operator. All worked examples are original illustrations written in the style of the paper, not reproduced competition questions. Official rules and the published topic outline are set by the competition and change yearly – confirm current details on amt.edu.au and the ASDAN China-region listing. Any factual error reported to us is corrected within 7 working days.