
The Australian AMC China-region paper was sat on 11 October 2026. By late October, many families are already estimating raw scores and asking a narrow question: “Is 85 out of 135 enough for Distinction?” Or, for younger children, “Is 66 out of 100 enough for Credit?” These guesses spread quickly because raw scores feel concrete. A mark is a number, and numbers seem comparable across different contexts. However, in competitive mathematics, the meaning of a number is entirely dependent on the distribution of the population it belongs to.
For the China region, however, the award bands are not set by a fixed raw score. They are set by percentile position within the same level. That single fact changes how families should read Australian AMC 2026 China Results: The 6–8 Week Window, Score Report and Who to Ask. It also explains why copying a previous year’s cut-off onto 2026 is not reliable. Understanding this mechanism is crucial for interpreting your child’s performance accurately and avoiding unnecessary anxiety during the waiting period.
The China-region award bands are percentile bands
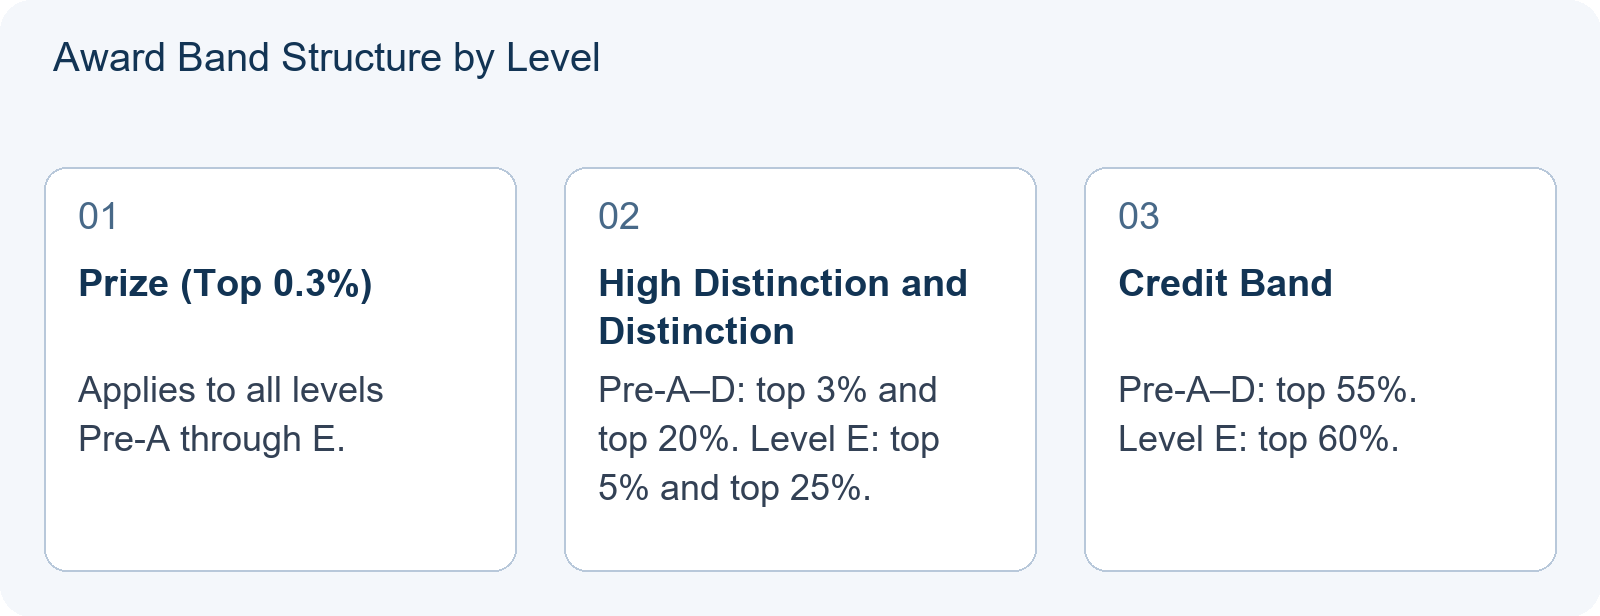
The 2026 China-region structure sets six levels from Pre-A to E, covering Grades 1–12. Awards are assigned by rank within each level, not by one national raw-score line. This means that every student competes only against peers sitting the exact same level paper. The bands are defined as follows:
- Prize: top 0.3% of participants at the level. This is the highest honor, reserved for the absolute elite performers in each grade group.
- High Distinction: top 3% for Pre-A through D; top 5% for Level E. This band recognizes exceptional proficiency relative to the cohort.
- Distinction: top 20% for Pre-A through D; top 25% for Level E. This indicates a strong performance well above the average participant.
- Credit: top 55% for Pre-A through D; top 60% for Level E. This award signifies a solid grasp of the material, placing the student in the upper half of the cohort.
There is also a Proficiency award, also called the Mathematics Skills Award in some China-region descriptions. It is not simply another percentile band. It is for students who meet a score requirement but do not receive Prize, High Distinction, Distinction or Credit. In 2025, the reported Proficiency line was 32 points across grades. That is useful history, but it is not a 2026 promise. The existence of this separate category highlights that the primary awards are strictly relative rankings, while Proficiency acts as a baseline competency marker.
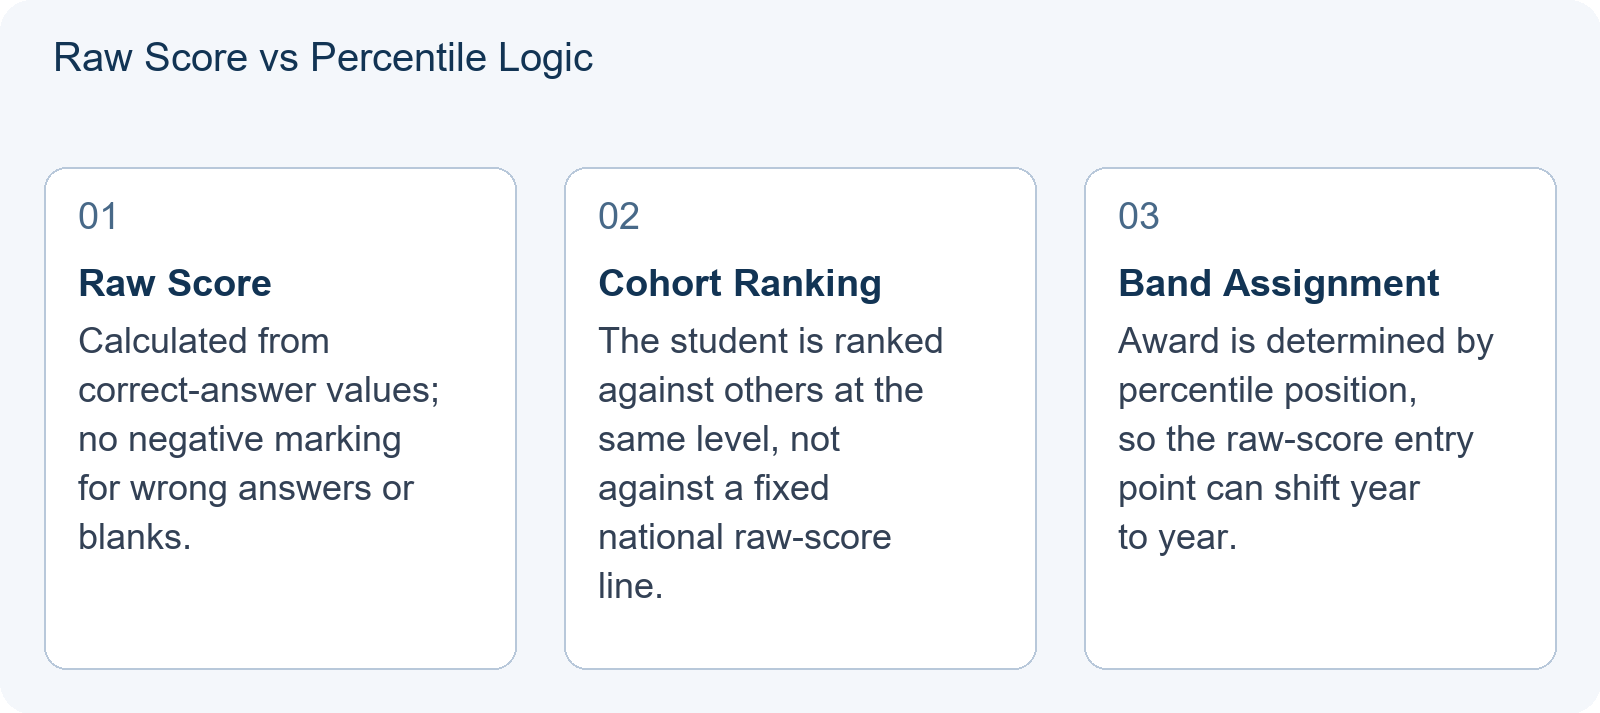
The key implication is simple: a raw score is an input into ranking, not an output that directly names an award. Two students with the same 85/135 at different levels could land in different bands if the level cohorts differ. A student at Level E is compared with Level E candidates, not with Pre-A or Level C candidates. This isolation of cohorts ensures fairness across age groups but makes cross-level comparison meaningless.
Why a raw score such as 103/135 or 66/135 is not automatic
Families often look for a single conversion: “103/135 must be High Distinction” or “66/135 must be Credit.” That logic assumes the award line is fixed. Under a percentile system, the raw score needed to reach the top 3%, top 5%, top 20% or top 25% depends on how the whole level performs. If the 2026 paper was harder than a previous year’s paper, the raw score needed for High Distinction might be lower. If the paper was easier, the raw score needed might be higher.
The percentile band stays stable in definition while the raw-score entry point moves. That is why the 2025 Proficiency line of 32 is best treated as a historical landmark, not as a template for 2026. The same caution applies to any online claim that “70 is enough” or “100 is safe.” Without the final level distribution, such numbers are guesses. They may feel precise, but they are not evidence of a 2026 band. Because the paper changes from year to year, the raw score attached to any given band changes with it, even though the band percentages themselves do not.
How the scoring structure makes raw scores uneven
The 2026 China-region paper uses two scoring formats. For Pre-A, there are 25 questions and a total of 100 marks:
- Questions 1–10: 3 marks each, 30 marks total.
- Questions 11–20: 4 marks each, 40 marks total.
- Questions 21–22: 5 marks each, 10 marks total.
- Questions 23–24: 6 marks each, 12 marks total.
- Question 25: 8 marks.
For Levels A–E, there are 30 questions and a total of 135 marks:
- Questions 1–10: 3 marks each, 30 marks total.
- Questions 11–20: 4 marks each, 40 marks total.
- Questions 21–25: 5 marks each, 25 marks total.
- Questions 26–30: 6, 7, 8, 9 and 10 marks respectively, 40 marks total.
There is no negative marking for wrong answers or blanks. That means a student’s raw score is the sum of correct-answer values. But the later questions carry much more weight. A single mistake on Question 30, worth 10 marks, can move the raw score more than several early mistakes. Yet because awards are percentile-based, the effect of that mistake depends on how many other students also missed Question 30 and where the level distribution settles.
A student who misses the final question might still be in a high band if most of the cohort also found it difficult. Conversely, a student who answers all early questions correctly but cannot reach the final section may still score well relative to peers. Raw-score guessing often ignores this cohort effect. Because more marks sit in the later questions, the marginal value of each additional mark increases towards the end of the paper.
Level E: wider bands, not an easier paper
Level E is the clearest example of why one fixed cut-off cannot cover every level. The China-region bands are wider at Level E:
- High Distinction: top 5% at Level E, compared with top 3% for Pre-A–D.
- Distinction: top 25% at Level E, compared with top 20% for Pre-A–D.
- Credit: top 60% at Level E, compared with top 55% for Pre-A–D.
Prize remains top 0.3% across Pre-A–E. The wider Level E bands mean that, in percentage terms, a larger share of Level E candidates can receive those awards. They do not mean the Level E paper is easy, and they do not create a lower fixed raw-score line that holds every year. The bands are fixed percentages; the raw score that lands a candidate inside them is not.
Teaching illustration only, not an actual 2026 cohort: suppose a simplified level had 1,000 students. At Level E, the top 5% would be 50 students. At a Pre-A–D level with the same simplified cohort size, the top 3% would be 30 students. The arithmetic is 0.05 × 1,000 = 50 and 0.03 × 1,000 = 30. Under that simplified comparison, the Level E band contains more places. It does not tell us what raw score those 50 students would need. This illustrates that the threshold for entry into a band is dynamic, depending entirely on the scores of the students ranked just outside that boundary.
What to do during the 6–8 week wait
Results and rankings are expected 6–8 weeks after the 11 October exam. That places the likely window in late November to early December 2026. During this period, unofficial score estimates can create unnecessary anxiety because they cannot replicate the final level distribution. Families often seek immediate validation, but the data required to provide it does not yet exist publicly.
A more useful project is to review reasoning, not to invent a cut-off. Ask which questions consumed too much time. Ask whether the error came from a misread condition, a rushed calculation, an unfamiliar diagram, or a topic gap. This turns the post-exam period into preparation for the next step. Reviewing the specific mechanics of lost marks is far more valuable than guessing the final percentile rank.
For students who may move toward AMC8-style preparation, the skills overlap but the competitions are distinct. The Australian AMC to AMC8 transition: From Australian AMC October to AMC8 January: A Three-Month Skill Bridge page is relevant because the next few months can be used to build speed and accuracy in a different format. That said, the immediate task is not to compare an Australian AMC raw score with an AMC8 score. They are separate tests with different levels, timing and cohorts. Using this time to bridge skill gaps identified in the Australian AMC attempt is a strategic use of the waiting period.
Families who want a concrete review focus can also read From Credit to Distinction: The Middle Questions Decide Your Australian AMC Band (2026). The middle questions often reveal whether a student is losing marks to pace, not just to difficulty. That is a more productive use of the waiting period than treating a guessed raw score as a predicted award. Identifying whether errors were due to knowledge gaps or execution failures helps tailor future practice effectively.
How to read the result when it arrives
When the China-region results are published, read the award band together with the level. Do not read the band as a fixed raw-score formula. The award category is the definitive outcome of the percentile ranking process.
- Confirm the award band first. The result will identify the award category, such as Prize, High Distinction, Distinction, Credit or Proficiency. This is the primary outcome of the percentile ranking. Ignore any rumors about specific score thresholds until you see the official distribution data if available.
- Check the level attached to the band. Pre-A–D and Level E use different percentage thresholds for High Distinction, Distinction and Credit. A band at Level E is not directly interchangeable with the same band name at Level D. The context of the level determines the competitiveness of the award.
- Interpret the band relatively. A Credit means the student was within the Credit percentile range for that level and year. It is not a statement about a fixed raw-score line. The same is true for Distinction and High Distinction. The award reflects standing among peers, not absolute mastery of a universal standard.
Some families will want to compare the 2026 outcome with older results. That can be useful only if the comparison stays honest. A 2026 raw score cannot be carried backward and treated as if the paper, cohort and level distribution were identical. The percentile band is the stable part; the raw-score entry point is the moving part. Historical comparisons should focus on trends in percentile placement rather than raw score equivalence.
Conclusion: use the percentile band as a signal
For Australian AMC results in the China region, the award is not a simple function of raw score. Prize, High Distinction, Distinction and Credit are percentile bands. Level E uses wider bands than Pre-A to D. The 2025 Proficiency line of 32 is historical information, not a 2026 cut-off. The expected results window is 6–8 weeks after the 11 October exam.
The most useful response while waiting is to stop searching for a fixed conversion number and start reviewing the reasoning behind the raw score. When the official result arrives, the percentile band will tell the student where they stood among their level peers. That is the correct signal to use for the next round of practice. Focus on the relative standing and the specific areas of improvement rather than chasing an arbitrary score target that may not apply to the current year’s cohort.
Frequently Asked Questions
Can I predict my child’s award using last year’s cut-off scores?
No. China-region awards are based on percentiles within each level, and the raw score needed for a given percentile can change with paper difficulty and cohort performance. The 2025 Proficiency line of 32 is historical information, not a fixed 2026 cut-off.
Why are the award bands different for Level E?
The China-region structure sets wider percentage bands at Level E: High Distinction top 5%, Distinction top 25%, and Credit top 60%, compared with top 3%, top 20%, and top 55% for Pre-A to D. Prize remains top 0.3% across levels.
When will the 2026 Australian AMC results be released?
Results and rankings are expected approximately 6 to 8 weeks after the 11 October 2026 exam. That places the expected window around late November to early December 2026.